原名:Depth-dependent drivers of soil microbial necromass carbon across Tibetan alpine grasslands
译名:青藏高原高寒草地土壤微生物残体碳的驱动者取决于土壤深度
期刊:Global Change Biology
2020年影响因子: 10.863
在线发表时间:2021.11.02
第一作者:Mei He
通讯作者:Yuanhe Yang
第一单位:中国科学院植物研究所植被与环境变化国家重点实验室
研究背景
微生物坏死碳(C)被认为是持久性土壤碳库的重要贡献者。然而,目前还缺乏对不同土层特别是高山生态系统微生物坏死量C的大规模系统观测。此外,植物碳输入和矿物性质等生物和非生物变量在调节微生物坏死量C方面的相对重要性是否会随土壤深度而改变尚不清楚。
研究方案
沿着青藏高原约2200公里的高寒草地样带进行了大规模采样,共采集了36个地点的表土和底土样品(Figure 1a),并根据氨基糖估算了微生物残体C的含量。为了探索微生物残体C的关键决定因素,检测了各种生物和非生物因素,包括植物碳输入、微生物性质(如微生物生物量C (MBC)、总磷脂脂肪酸(PLFAs))、矿物保护(粘土含量、铁/铝氧化物和交换性钙)和土壤理化性质(如:土壤温度、有机碳与全氮比)。进一步采用方差分解分析(VPA)和结构方程模型(SEM)定量分析了这些因素对土壤微生物残体C空间变化的相对贡献。
主要研究结果
在36个采样点,表层和深层土壤的微生物残体C分别为0.55 ~ 34.78和0.40 ~ 15.19 mg g-1 dry soil,平均值分别为9.57, 1.72和3.29, 0.57 mg g-1 dry soil. 高寒草原、高寒草甸以及整个高寒草地的微生物残体C均随土壤深度的增加而显著降低(Figure 1 c)。与总微生物残体C一致,真菌和细菌残体C在表土中显著高于底土(Figure S1)。而在有机碳归一化条件下,两种草地类型的土壤微生物残体C含量均无显著差异(高寒草原:P = 0.47;高寒草甸:P = 0.40)或整个高寒草甸(P = 0.28,Figure S2)。有趣的是,高寒草地微生物残体C对土壤有机碳的贡献显著低于全球草地 (表土:45.4% vs 58.1%;底土:41.7% vs. 53.7%; Figure S3)。
微生物残体C的主要决定因素与土壤深度有关。在表土中,微生物残体C随植物C输入量、MBC、总PLFAs、真菌PLFAs和细菌PLFAs的增加而显著增加(Figure 2a-e)。与黏土含量、Caexe、Feo+Alo和Fep+Alp也表现出正相关 (Figure 3a-d)。此外,微生物残体C随土壤理化参数的变化而变化,与土壤水分和有机碳/全氮 (Figure 4b-d),但与土壤pH值呈负相关(Figure 4c),与土壤温度没有显著关系 (Figure 4a)。与表土相似,底土微生物残体C与植物C输入量、总PLFAs、细菌PLFAs (Figure 2f, h, j),粘土含量,Caexe, Feo+Alo, Fep+Alp (Figure 3e-h) 呈正相关。与土壤湿度(Figure 4f),与土壤pH值(Figure 4g),但不受土壤温度(Figure 4e)和SOC/TN (Figure 4h)的调控。
VPA和SEM结果共同表明,微生物残体C的主导驱动因素在不同土壤深度之间存在差异 (Figure 5-7)。对于表层土壤,VPA结果表明植物C输入和矿物保护在调节整个研究区微生物残体C的积累中发挥了重要作用。植物C的输入和矿物保护完全解释了92.6%的微生物残体C的空间变异 (Figure 5a)。SEM分析还表明,微生物残体C主要受植物C输入和矿物保护的直接影响 (Figure 6a),标准化直接效应分别为0.48和0.55 (Figure 7a)。此外,植物C的输入通过调节土壤pH和矿物保护间接影响微生物残体C (Figure 7a)。VPA结果表明,与表层土壤相比,在深层土壤中,矿物保护对微生物残体C变化的解释比例(30.1%)远高于植物C输入(4.1%) ( Figure 5b)。SEM分析证实了矿物保护在调节土壤微生物残体C中的重要作用 (Figure 6b)。生物和非生物因素共同解释了62%的微生物残体C的空间变异 (Figure 6b)。其中,矿物保护对微生物残体C的直接影响最大,而植物C的输入对最终的SEM没有直接影响 (Figure 7b)。
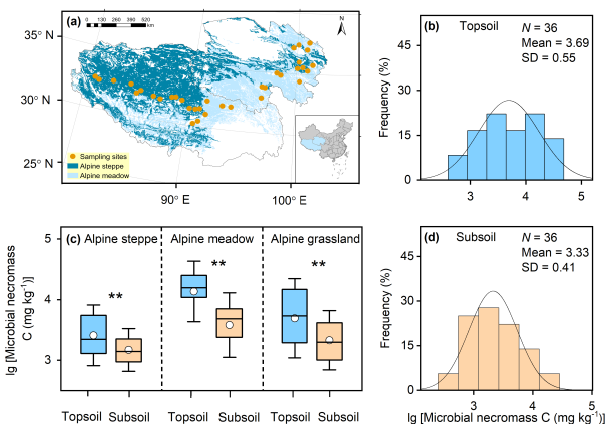
Figure 1 Geographic distributions of sampling sites (a) and frequency distributions of microbial necromass C in the topsoil (b) and subsoil (d) across Tibetan alpine grasslands, and comparison of microbial necromass C between the two soil depths in alpine meadow, alpine steppe and the whole alpine grassland (c). The vegetation map is derived from China's Vegetation Atlas (Editorial Committee for Vegetation Map of China, 2001). The horizontal lines and circles inside each box represent the medians and the mean values, respectively. The ends of the boxes show the 25th and the 75th quartiles, and the whiskers indicate the standard deviation (SD), respectively.
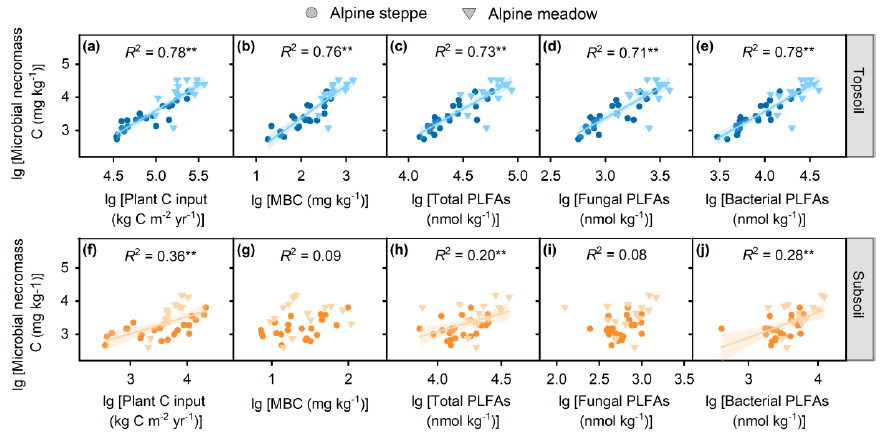
Figure 2 Relationships between microbial necromass C and biotic factors including plant C input (a, f), MBC (b, g), total PLFAs (c, h), fungal PLFAs (d, i) and bacterial PLFAs (e, j). Blue and yellow symbols represent data points in the topsoil and subsoil, respectively. The solid cycles and triangles represent data points from alpine steppe (n = 22) and alpine meadow (n = 14), respectively. The solid lines were fitted by ordinary least-squares regressions, and the shadow areas corresponded to 95% confidence intervals. * and ** represent significant level at P < 0.05 and P < 0.01, respectively. MBC: microbial biomass carbon. PLFAs: phospholipid fatty acids.
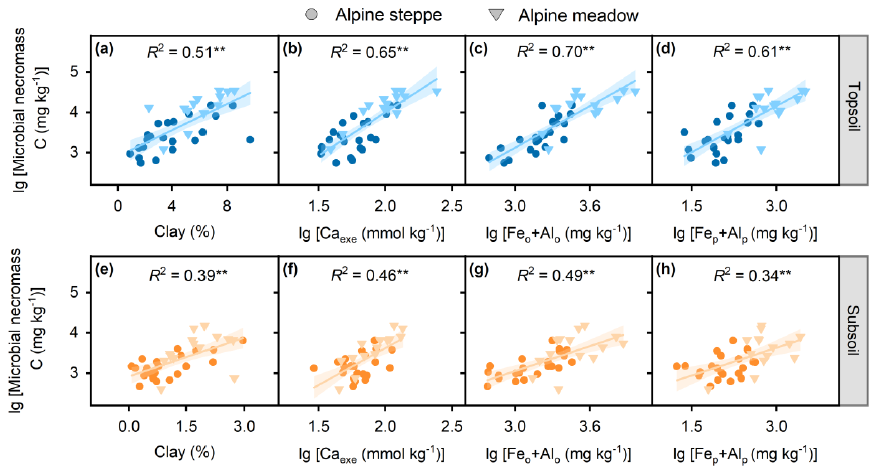
Figure 3 Relationships between microbial necromass C and mineral protection including clay content (a, e), Caexe (b, f), Feo+Alo (c, g) and Fep+Alp (d, h), respectively. Blue and yellow symbols represent data points in the topsoil and subsoil, respectively. The solid cycles and triangles represent data points from alpine steppe (n = 22) and alpine meadow (n = 14), respectively. The solid lines were fitted by ordinary least-squares regressions, and the shadow areas corresponded to 95% confidence intervals. * and ** represent significant level at P < 0.05 and P < 0.01, respectively. Caexe: exchangeable Ca2+; Feo+Alo: sum of pyrophosphate-extractable Fe/Al oxides; Fep+Alp: sum of oxalate-extractable Fe/Al oxides.
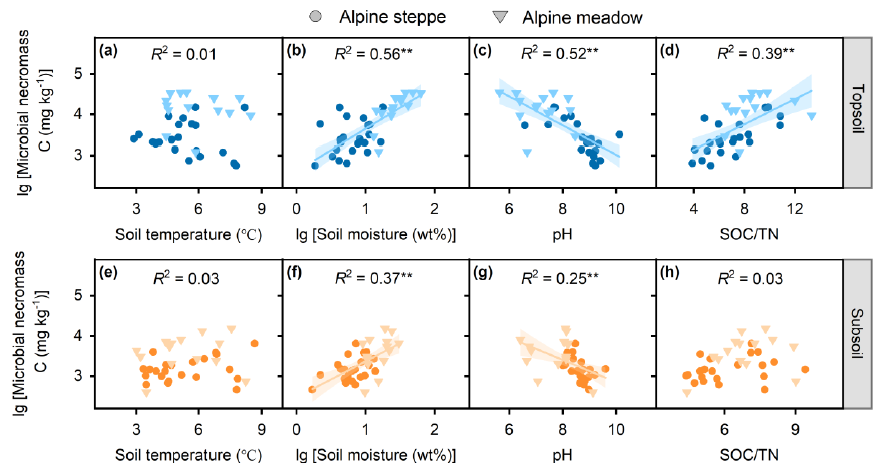
Figure 4 Relationships between microbial necromass C and soil physicochemical properties including soil temperature (a, e), soil moisture (b, f), soil pH (c, g) and SOC/TN (d, h), respectively. Blue and yellow symbols represent data points in the topsoil and subsoil, respectively. The solid cycles and triangles represent data points from alpine steppe (n = 22) and alpine meadow (n = 14), respectively. The solid lines were fitted by ordinary least-squares regressions, and the shadow areas correspond to 95% confidence intervals. * and ** represent significant level at P < 0.05 and P < 0.01, respectively. SOC: soil organic carbon; TN: total nitrogen.
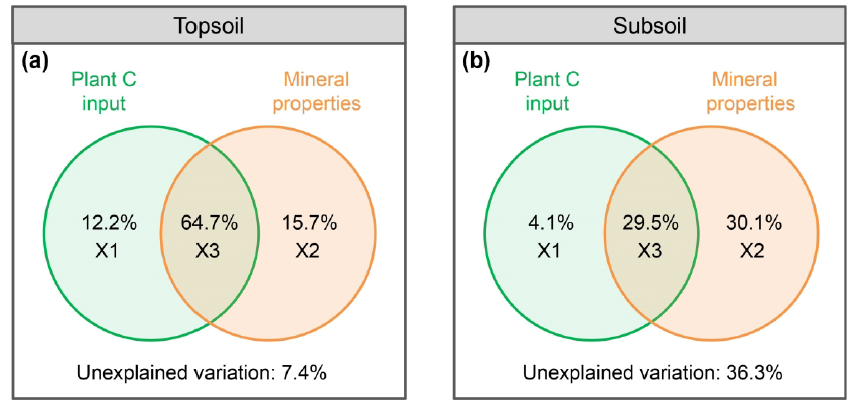
Figure 5 Results of variation partitioning analyses illustrating the relative contribution of plant C input and mineral protection to microbial necromass C in the (a) topsoil and (b) subsoil. The retained mineral variables by stepwise regression model were Caexe and Feo+Alo in both the topsoil and subsoil. X1 and X2 indicate the pure effect of each type of variable, and X3 suggests the joint effect of two types of variables. Caexe: exchangeable Ca2+; Feo+Alo: sum of pyrophosphate-extractable Fe/Al oxides; Fep+Alp: sum of oxalate-extractable Fe/Al oxides.
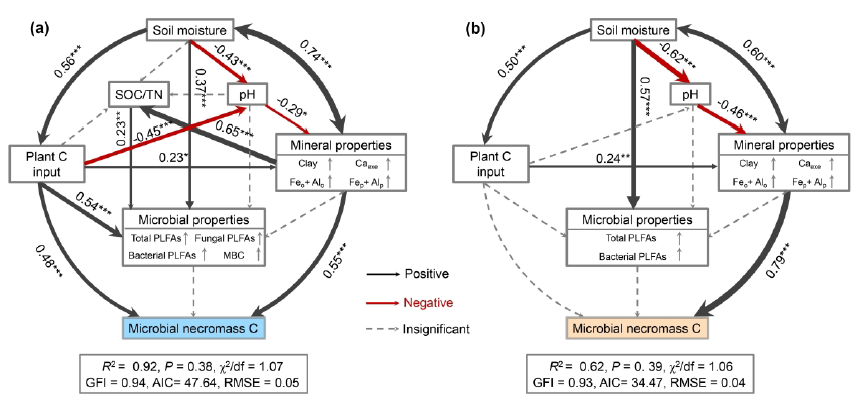
Figure 6 Structural equation models (SEM) revealing the direct and indirect effects of biotic and abiotic factors on microbial necromass C in topsoil (a) and subsoil (b). Black and red solid arrows indicate positive and negative associations, respectively. Dotted lines represent pathways that are not significant. Numbers adjoining the arrows indicate significant standardized path coefficients. The arrow width is proportional to the strength of the association. The multiple-layer rectangles indicate the first component from the PCA of mineral and microbial properties, and the vertical arrows within it represent the positive relationships between adjacent variables and the corresponding PC1. SOC: soil organic carbon; TN: total nitrogen; PLFAs: phospholipid fatty acids; MBC: microbial biomass carbon. Caexe: exchangeable Ca2+; Feo+Alo: sum of pyrophosphate-extractable Fe/Al oxides; Fep+Alp: sum of oxalate-extractable Fe/Al oxides; *, P < 0.05; **, P < 0.01; ***, P < 0.001.
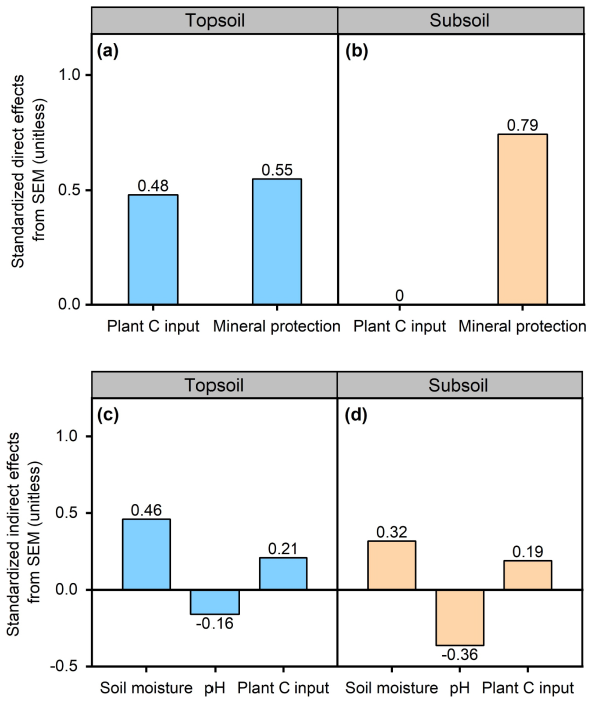
Figure 7 Standardized effects of each variables from the structural eaquation modelling (SEM) analysis. (a) and (b) represent standardized direct effects of plant C input and mineral protection in the top and subsoil, respectively; (c) and (d) correspond to standardized indirect effects of soil moisture, soil pH and and plant C input in the topsoil and subsoil, respectively. The values adjacent to the column represent the standardized coefficients in SEM.
结论
基于大规模调查和室内分析相结合的方法,青藏高原高寒草地表层和深层土壤微生物残体 C对有机碳的贡献率均高达40%。微生物残体C的主导因素也与土壤深度有关: 植物C输入的作用随着土壤深度的增加而减弱,而矿物保护的作用则随着土壤深度的增加而增强。因此,本研究强调土壤深度之间微生物残体碳的差异控制应纳入地球系统模型,以减少土壤碳动态预测中的不确定性。本研究还表明,矿物保护似乎是控制深层土壤微生物残体C长期稳定的关键机制,这可能会减缓气候变化下潜在的正C-气候反馈效应。